Understanding Descriptive Analysis
When we try to represent data in the form of graphs, like histograms, line plots, etc. the data is represented based on some kind of central tendency. Central tendency measures like, mean, median, or measures of the spread, etc are used for statistical analysis. To better understand Statistics lets discuss the different measures in Statistics with the help of an example.
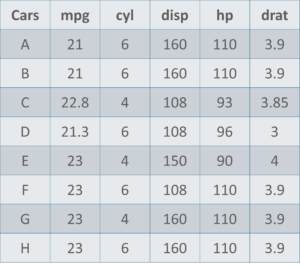
Here is a sample data set of cars containing the variables:
- Cars
- Mileage per Gallon (mpg)
- Cylinder Type (cyl)
- Displacement (disp)
- Horse Power (hp)
- Real Axle Ratio (drat).
Before we move any further, let's define the main Measures of the Center or Measures of Central tendency.
Measures Of The Center
- Mean: Measure of average of all the values in a sample is called Mean.
- Median: Measure of the central value of the sample set is called Median.
- Mode: The value most recurrent in the sample set is known as Mode.
- If we want to find out the mean or average horsepower of the cars among the population of cars, we will check and calculate the average of all values. In this case, we'll take the sum of the Horse Power of each car, divided by the total number of cars:
- If we want to find out the center value of mpg among the population of cars, we will arrange the mpg values in ascending or descending order and choose the middle value. In this case, we have 8 values which is an even entry. Hence we must take the average of the two middle values.
- If we want to find out the most common type of cylinder among the population of cars, we will check the value which is repeated most number of times. Here we can see that the cylinders come in two values, 4 and 6. Take a look at the data set, you can see that the most recurring value is 6. Hence 6 is our Mode.
- Range: It is the given measure of how spread apart the values in a data set are.
- Inter Quartile Range (IQR): It is the measure of variability, based on dividing a data set into quartiles.
- Variance: It describes how much a random variable differs from its expected value. It entails computing squares of deviations.
- Deviation is the difference between each element from the mean.
- Population Variance is the average of squared deviations
- Sample Variance is the average of squared differences from the mean
- Standard Deviation: It is the measure of the dispersion of a set of data from its mean.
- R is open-source and freely available. Unlike SAS or Matlab, you can freely install, use, update, clone, modify, redistribute and resell R.
- R is cross-platform compatible. It is compatible to run on Windows, Mac OS X and Linux. It can also import data from Microsoft Excel, Microsoft Access, MySQL, SQLite, Oracle and other programs.
- R is a powerful scripting language and it can handle large, complex data sets.
- R is highly flexible and evolved. Many new developments in statistics first appear as R packages.
Using descriptive Analysis, you can analyse each of the variables in the sample data set for mean, standard deviation, minimum and maximum.
Mean = (110+110+93+96+90+110+110+110)/8 = 103.625
The mpg for 8 cars: 21,21,21.3,22.8,23,23,23,23
Median = (22.8+23 )/2 = 22.9
Measures Of The Spread
Just like the measure of center, we also have measures of the spread, which comprises of the following measures:
Now that we've seen the stats and math behind Descriptive analysis, let's try to work it out in R.
Statistics In R
There are n number of reasons why the world is moving to R. A couple of them are enlisted below:
If you're still not convinced about why you must use R, the Statistical language, give this R Tutorialblog a read.