Predicted Performance vs. Actual Performance
One criticism of "green" buildings-which definitely has some merit-points to a lack of consistent demonstrated energy savings in these buildings. Analyzing the energy usage-for instance, simply collecting utility bills-is an excellent validation of performance. In addition, it allows comparisons between the computer energy simulations and actual performance. Sub-metered usage would provide even greater insight, but requires greater investment in instrumentation.
The utility bills for the past three years are shown. Gas was billed monthly, but electricity was only billed every two months, reducing available resolution. Heating degree days and cooling degree day data (NOAA data for Boston weather station) are also plotted for reference.
While the home was purchased and occupied starting in mid 2006, construction was taking place until the end of 2007. 2008 was the first full year of data after renovations were completed.

The most recent 12 months of bills were examined to see how they compared to the model. During that period, weather and house operating conditions were as follows:
- 5,448 HDD Base 65°F (Boston weather site 5,596 HDD; this year was 3% lower);
- two occupants (both adults) living in the house;
- interior thermostat setpoint 69°F winter/74°F summer; and
- exhaust fan in second floor central bathroom continuously runs (~50 cfm).
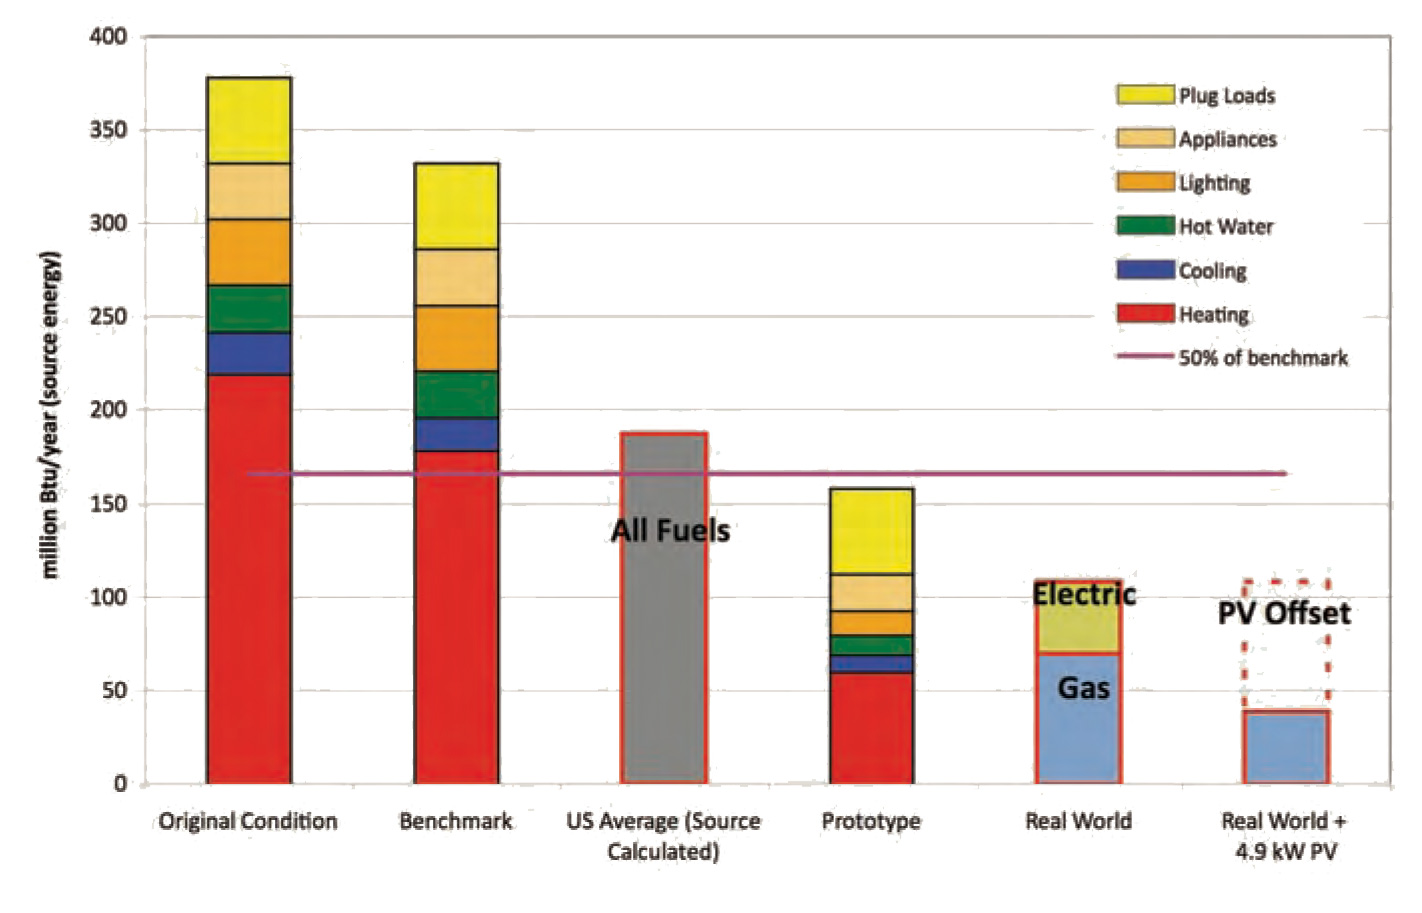
The resulting energy use is shown on the bar graph, "Energy Use Before, After Renovation." It shows the annual gas and electric use (in terms of source energy), with the unrenovated house, Benchmark and model for comparison.
The utility bill data showed even greater savings (54%) than what was modeled (44%). The graph shows that gas use was less than predicted (614 therms vs. 731 therms); space heat and domestic hot water were provided by gas.
Similarly, electrical use was less than predicted (3,865 kWh versus 5,694 kWh simulation). The air-conditioning use-and therefore, resulting load-were lower than expected.
One final step was to examine the effect of adding a photovoltaic system using renewable energy to reduce the net energy use. A 4.9 kWp system would produce roughly 6,000 kWh/year in a Concord, Mass., climate at the orientation used. This would more than cover the meter electrical use of the past year (3,865 kWh), and start to partially offset the energy use of site fuel combustion (gas use). Note that in the graph "Energy Use Before, After Renovation," the electricity produced by the PV system is graphed in terms of the amount of source energy it offsets (i.e., roughly three times multiplier). The overall result would be an 83% reduction from the benchmark house.