The Thematic Data Chart
What is the data chart?
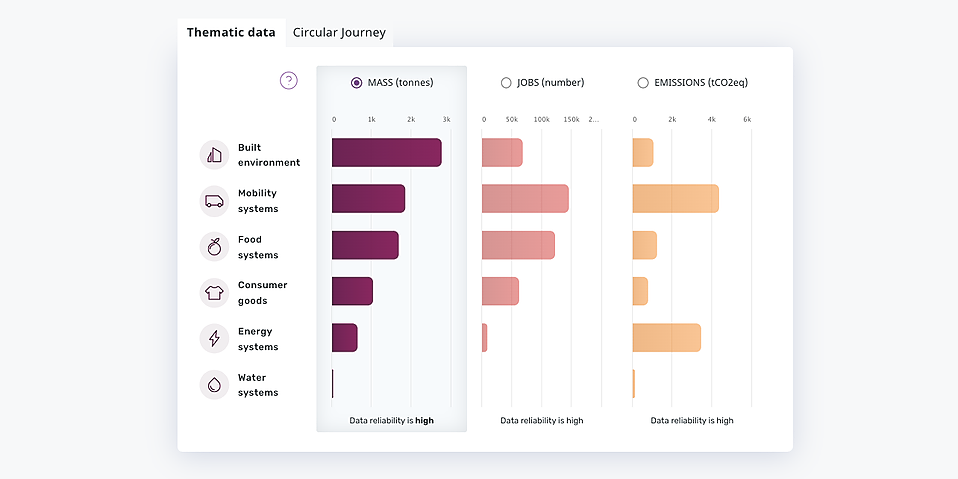
The data chart can guide your circular economy decision-making, marking the first step toward a holistic overview of your city. Alongside employment, which is a common indicator of economic activity and often used as a proxy for social wellbeing, the chart shows emissions data and material consumption data. These two data points are physical data points about the environment that provides a different lens to economic activity in the city.
You will notice that the data chart is not organised into traditional sectors but rather into thematic areas (read more about thematic areas here).
See the following pages for a description of the indicators, the thematic areas, and how to use the data chart.